Plotting, Planars, and Linkin Park: The Field Tech Life

Keeping tabs on our forests and their health is a full time job, and not everyone is cut out for it! To better understand how Whitebark Institute is measuring forest health outcomes, we spent an afternoon with our field technicians trapezing around the forests of Mammoth Lakes.
Our two Field Technicians are leading our forest health monitoring efforts this summer. Equipped with high-viz orange vests, sunhats, and sturdy boots, our techs are out in the forest everyday measuring, recording, and tracking our project sites to see how our actual outcomes stack up against our goals.
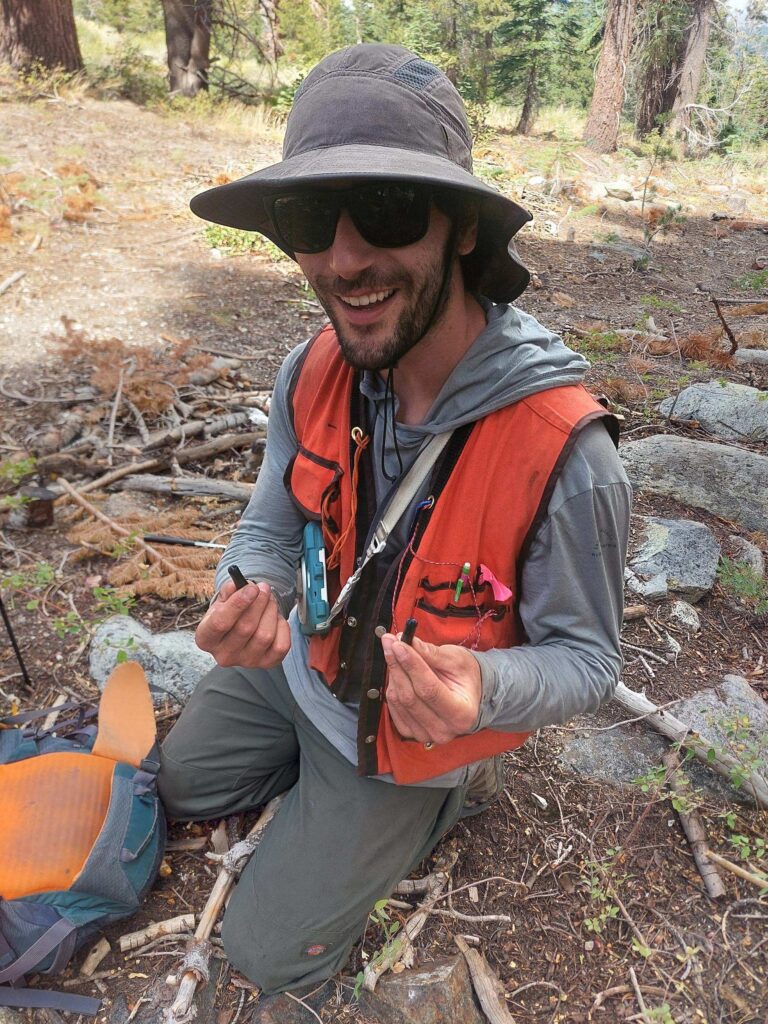
Their vest pockets are brimming with tools ranging from measuring tapes and stakes to clinometers and trowels. Our technicians, Isaac and Ruthie, have a well-dialed system: they check their maps and double-check their gear before heading into the forest to locate each plot.
Monitoring plots are established prior to project start dates to collect baseline data on pre-treatment forest conditions. Field-based monitoring plots complement what we gather through drone-based imaging, providing more detailed information on tree health and fuel loading. Once baseline conditions have been measured, contracted crews begin forest health implementation removing dead and down debris material, reducing stand density, and building woody debris piles for future burning. After implementation work wraps up, our field technicians revisit the original plot sites to measure post-treatment conditions.

Each plot evaluation begins with establishing a Brown’s Transect. First developed in 1971 by James K. Brown, the Brown Planar Transect Method estimates the volume, weight, and biomass of downed woody debris, litter, and duff in an ecosystem. From the center of the plot, measuring tapes are extended 8 meters out in each of the four cardinal directions (North, South, East, West). Technicians then use a “go/no-go” gauge to classify every piece of woody debris that crosses the transect line. Fuels are categorized by size class, which correlates to time-lag fuel categories:
- 1-hour fuels: Less than 1/4 inch in diameter
- 10-hour fuels: 1/4 inch to 1 inch in diameter
- 100-hour fuels: 1 inch to 3 inches in diameter
- 1000-hour (coarse) fuels: Greater than 3 inches in diameter (measured individually for precise diameter and assigned a decay class from 1 to 5)
The second round of measurements focuses on soil disturbance and compaction. Technicians dig small holes along the transects to inspect soil cross-sections and measure duff and litter depth.
“Depending on the treatment, we see very different soil disturbance levels,” explains Isaac. “With whole-tree skidding, for instance, we might see very little remaining duff, or duff mixed with mineral soil from moving cut trees across the forest floor. Cut-to-length treatments tend to have less impact because the slash from felled trees helps protect the soil.”
Isaac Roter, Field Technician
After finishing transect data, technicians estimate ground cover percentage, vegetation, ICO (Individuals, Clumps, and Openings) patterns, tree regeneration abundance and species diversity.
They also measure the diameter of standing trees within the fixed radius plot to estimate carbon storage and to assess whether the remaining timber aligns with treatment objectives for forest structure and composition. In a single plot, technicians log over 50 data points. The Forest Health Team processes the data through statistical analysis to compare post-treatment results directly against target metrics. Ultimately, these data reveal how our management activities alter fuel loading on the landscape and how future wildfires might move through treated areas. Though the project goals may differ from site to site, reducing the severity and intensity of future fire behavior is often the primary objective.
Field monitoring is demanding work, but despite long hours and repetitive tasks, our tech team keeps morale high. In fact, it’s rare to see them without a smile jamming to Linkin Park. When asked how they stay motivated through long days of data collection, Ruthie shared:
“The work feels meaningful. You get to spend your days in the forest knowing that what you’re doing matters. We’re helping build healthier forests and reduce wildfire risk in our communities. Plus, the real secret to a good field day is a great playlist!”
Ruthie Griggs, Field Technician
If you see Ruthie and Isaac out in the field this summer, give them a wave, some words of encouragement or offer a snack. Or, listen along with their favorite Spotify playlist below. They’re putting in some hard yards out there for our communities and we appreciate all their hard work.